GMS

Troubleshooting MODFLOW in GMS

When constructing a MODFLOW model in GMS, there is always the possibility that you will get an error when trying to run your model. While there are a number of things that could be keeping your model from running without an error, here are some tips to help you figure out what may be going wrong.

Example of the MODFLOW Model Checker

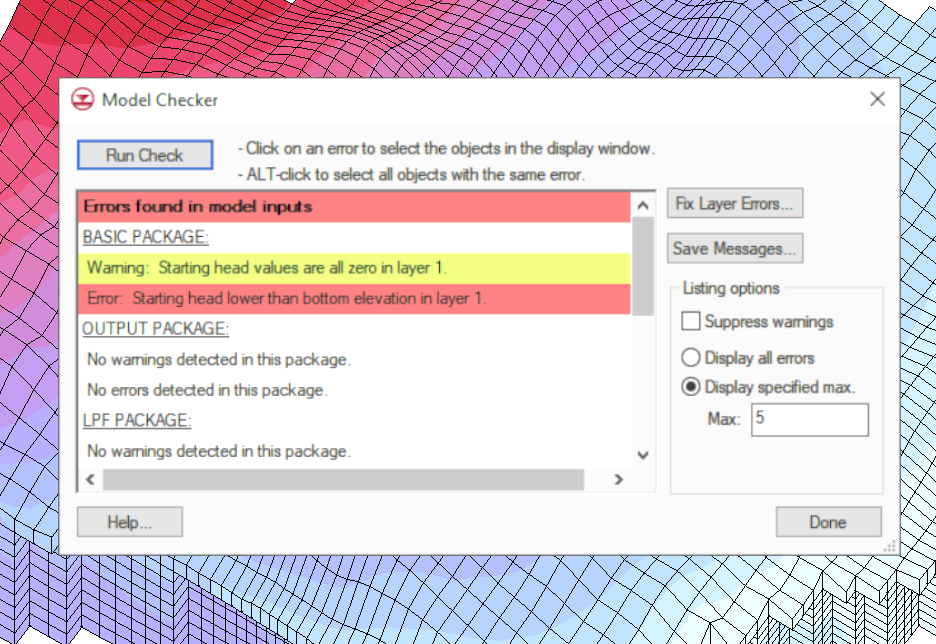
Before running MODFLOW, make use of the Model Checker. The Model Checker will analyze all the current input data for any obvious errors or potential problems, which could save you from having to hunt down individual input errors. The Model Checker gives you a few options for sorting and displaying errors. The Model Checker is a useful tool for a basic check of the inputs, however the Model Checker coming up clean doesn’t necessarily guarantee that the solution is correct.

Example of the MODFLOW Model Checker 
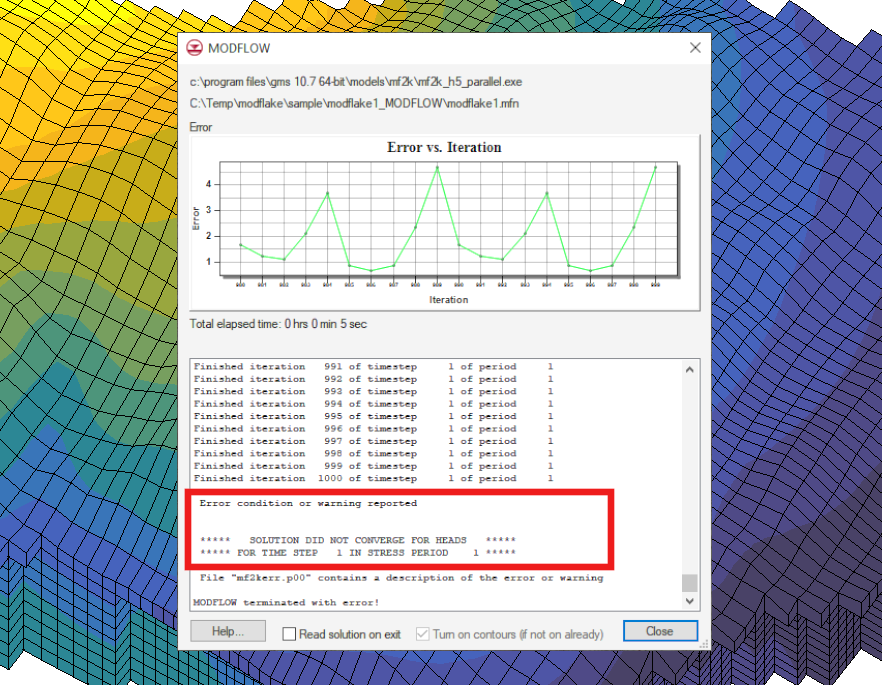
The next thing to look at in your MODFLOW model when you’re trying to figure out what the issue may be is the command line output from the MODFLOW model wrapper dialog. When the model does not converge, an error message should appear in the command line output. This message will help you know where to start resolving the issue.

Another place to look when you’ve encountered an error is the MODFLOW output file (*.out) in the solution files in the Project Explorer. You can use this text file to check for any missing or incorrect values.

Now that we've covered some ways to check your MODFLOW model for errors, here is a common issues that may be what is keeping your MODFLOW model from converging properly:

  • An unbalanced flow budget. This can happen if the inflow is greater than the outflow, which causes extreme flooding, or if the outflow is greater than the inflow, which would cause all cells to go dry.
  • All grid cells in the model are assigned a specified head boundary condition. This leaves nothing for MODFLOW to compute, causing the model to terminate with an error.
  • Improper initial conditions or boundary conditions.
  • You have a highly sensitive model. Highly sensitive areas might keep MODFLOW from converging due to the speed at which flow can be affected.
  • Elevation and layer values have been incorrectly defined or have inaccuracies.

Additional information can be found in the Frequently Asked Questions section of the MODFLOW user manual under the question "My model hasn’t converged. What can I do?"

Use these tips to help your MODFLOW model run smoothly in GMS.

Note this is an update to a previouisly published blog post.

Blog tags: 

Announcing GMS 10.8 Beta!

We are pleased to announce the release of GMS 10.8 in beta! There are many updates and additions that have been made in the newest version of GMS and this blog post will explore just a few of the new tools and functionalities.

HydroGeoSphere

HydroGeoSphere is a model brand new to GMS, which will be available to you in GMS 10.8 beta. The HydroGeoSphere model was developed by Aquanty to accurately replicate the intricate processes involved in the terrestrial part of the hydrological cycle using a three-dimensional control-volume finite element simulator.

3D UGrid from Rasters

The 3D UGrid from Rasters tool is new to the GMS toolbox. This tool is found under the Unstructured Grids folder in the toolbox, and can be used to generate a 3D UGrid using multiple rasters and a 2D UGrid. It creates layers between the rasters using the 2D UGrid and the horizons approach. When this tool is used, the resulting 3D UGrid has no vertical sub-discretization of the layers, and the horizontal discretization of all the layers is the same. More information about this tool can be found on this page of our wiki.

3D UGrid from Rasters tool
MODFLOW-USG Transport

MODFLOW USG Transport in GMS has new support for seepage elevation and concentration in the Recharge (RCH) package. The Evapotranspiration (EVT) package now supports ETFACTOR.

Color Ramp

The way the color ramp in the contour display options works has been updated, and many new color options have been added to GMS 10.8. The way the color ramp works has been changed to more closely resemble the changes that have already been made in SMS and WMS. If you want a more detailed explanation of how to use this version of the color ramp, you can check out this blog post. The blog post covers the color ramp for SMS, but the functionality is basically identical between SMS and GMS.

There are a lot of new things to try in GMS 10.8 beta, so download it from our website and check it out today!

Blog tags: 

Utilizing the Transient Step Function Method

The Groundwater Modeling System (GMS) provides tools for working with transient MODFLOW simulations. When working with transient dataM in a MODFLOW model, it is important to understand stress periods and how GMS calculates their values. There are two different methods you can use to define the values for a stress period: the continuous time series method, and the step function method. This blog post will cover how to input the data for a stress period in the XY Series dialog so that GMS will calculate their values correctly.

Transient MODFLOW simulations use time intervals called stress periods to define the values of transient stresses such as pumping rates, and river stages. The values for stress periods are entered in the XY Series dialog, which is opened from the Attribute Table dialog. For a continuous time series, you need to enter only one data point per time step. When you enter only one value per time step, GMS assumes that the value continues to increase through the stress period, creating a straight line connecting the two points for a smooth transition. But because GMS needs a constant value for each stress period, it will take an average of the starting values of that particular stress period and the starting value of the following stress period.

The step function method tells GMS that there is only one value for each stress period, rather than a continuously increasing value. To input data in the XY Series dialog so that GMS knows that there is only one constant value through the entire stress period, you’ll need to enter both a start value and an end value. The figure below shows an example of the format to use.

Step function in GMS

As you can see in the above figure, you need the end value of a stress period to match the start value of the following stress period. This creates "steps" in the data, telling GMS to read a constant value through the entire stress period, rather than having a gradual increase from beginning to end.

Head over to GMS and try creating a step function for your transient MODFLOW model today!

Blog tags: 

Solution for Overlapping Points in MODFLOW

When using the Groundwater Modeling System (GMS), it is important to understand how cells work in MODFLOW models, especially with conceptual models. Conceptual MODFLOW models are defined using feature objects such as points, arcs, and polygons on a grid. GMS processes each feature object separately, and occasionally there may be more than one feature object in a cell. MODFLOW is able to handle more than one boundary condition in a cell simultaneously, however, there are some things you should note.

The use of coordinates is essential to GMS as a whole, but not to MODFLOW. GMS uses coordinates to keep track of the exact location of feature objects relative to each other, as well as relative to the grid and other model data. Because the cell is the smallest unit of measurement in MODFLOW models, it only cares about the contents of the cell and not the specific location within it. All feature objects within the cell are mapped to the cell center and used for the cell calculations simultaneously.

When importing MODFLOW data that wasn't created in GMS, there are no coordinates tied to that data, so GMS uses the cell center as a reference and places all points there. This poses a problem as GMS requires that all points are assigned to unique coordinates, so GMS will generate an error message if any two or more points share an x, y, and z location. The way to fix this is pretty straightforward, although it can become tedious depending on the number of points on your grid. To solve this problem, follow these steps:

  1. Open the Attribute Table dialog by double-clicking on a point in the Graphics Window.
  2. Make sure the Feature type is set to "Points", and the Show dropdown is set to "All".
  3. Check the box next to Show coordinates.
Overlapping points in MODFLOW

Now you can identify which points share the same coordinates and make the necessary changes. GMS only cares if more than one point has exactly the same coordinates in the x, y, and z directions. Offsetting a point even slightly in one of the three directions is enough for GMS to no longer have a problem, and the calculations will come out the exact same as long as the point remains within the original cell.

Head over to GMS and use these tips to make sure your MODFLOW simulation runs smoothly!

Blog tags: 

Pages