SMS

Introducing the Toolbox in SMS 13.2

One of the new features added to SMS 13.2 is the Toolbox. The addition of the Toolbox allows multiple tools to be collected into one location. Many of these tools previously existed in other locations in SMS such as the Dataset Toolbox. In addition to these tools new tools have been developed for the Toolbox.

You can access the Toolbox using the Toolbox macro button located on the macro toolbar. Clicking the macro will open the Toolbox dialog containing a list of available tools.

The tools have been organized into folders in the Tools tab. Examples of folders include: Coverages, Datasets, Rasters, and Unstructured Grids.

  • Coverage tools are used to manipulate coverages and feature objects.
  • Datasets tools are many of the tools that have previously existed in the Dataset Toolbox and are used to manipulate datasets.
  • Rasters and Lidar tools are used to adjust and clean up raster and lidar data.
  • Unstructured Grid tools can manipulate and adjust unstructured grids (UGrids).
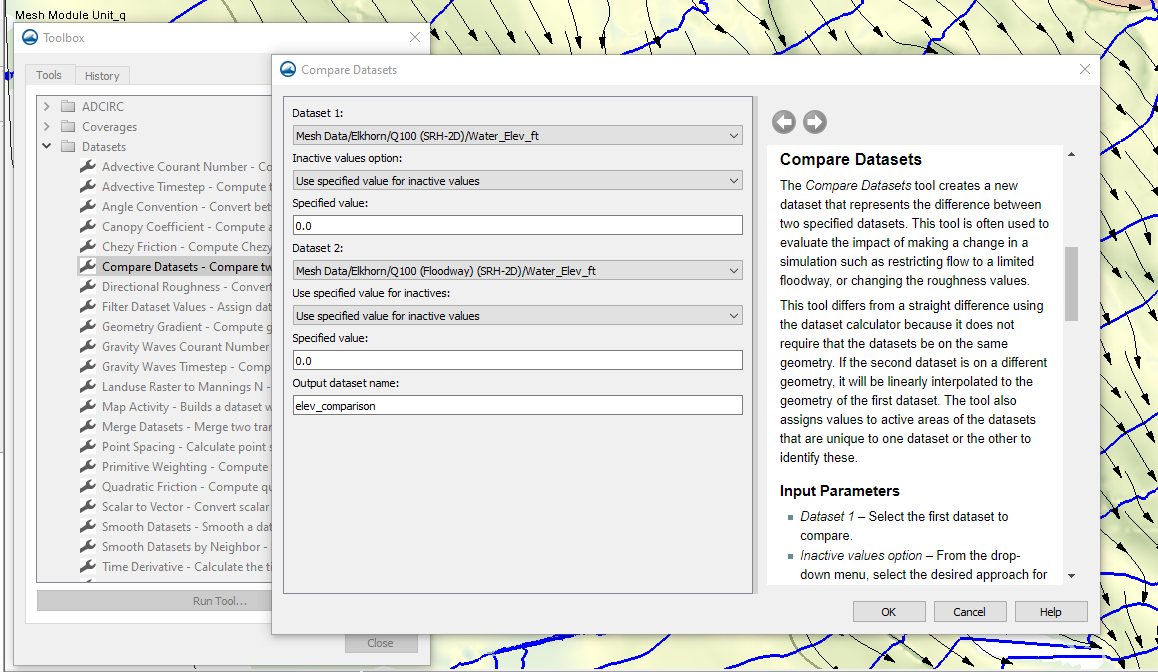
Example Compare Dataset Tool in the Toolbox for SMS 13.2

In addition, there will be folders for manipulating data related to specific numeric models. For example, there is a folder with tools that work with ADCIRC data.

The Toolbox also contains a History tab. This tab keeps a record of all the tool runs used with your projects. As a result, it allows you to run the same tool again using the same settings. For example, you might use the Compare Dataset tool to compare the solution sets from two different simulations, then discover that there was an issue in one of the simulations. After you fixed the simulation and ran it again, you could use the history feature of the toolbox to run the Compare Dataset tool using the same settings as before.

The History tab also shows if a tool executed successfully or not. Furthermore, it lets you make notes on the different tool runs, allowing you to clarify why a tool run failed or what you were hoping to accomplish with a particular tool. This can facilitate collaborating with colleagues when working on the same project.

Additional tools will be added to the Toolbox in future versions of SMS. Try out the Toolbox in SMS 13.2 beta today!
Blog tags: 

Announcing SMS 13.2 Beta

We are pleased to announce that SMS 13.2 has been released in beta. SMS 13.2 beta includes many new features to aid in your surface-water projects. Here are a few of the new features we’re excited about.

SRH-2D Improvements

SMS continues to add support for SRH-2D. SMS 13.2 has improved support for modeling HY-8 structures as links to allow for 2D flow overground.The sediment transport options have also been improved. Additional tools for SRH-2D include calibration options and report generation.

New Toolbox

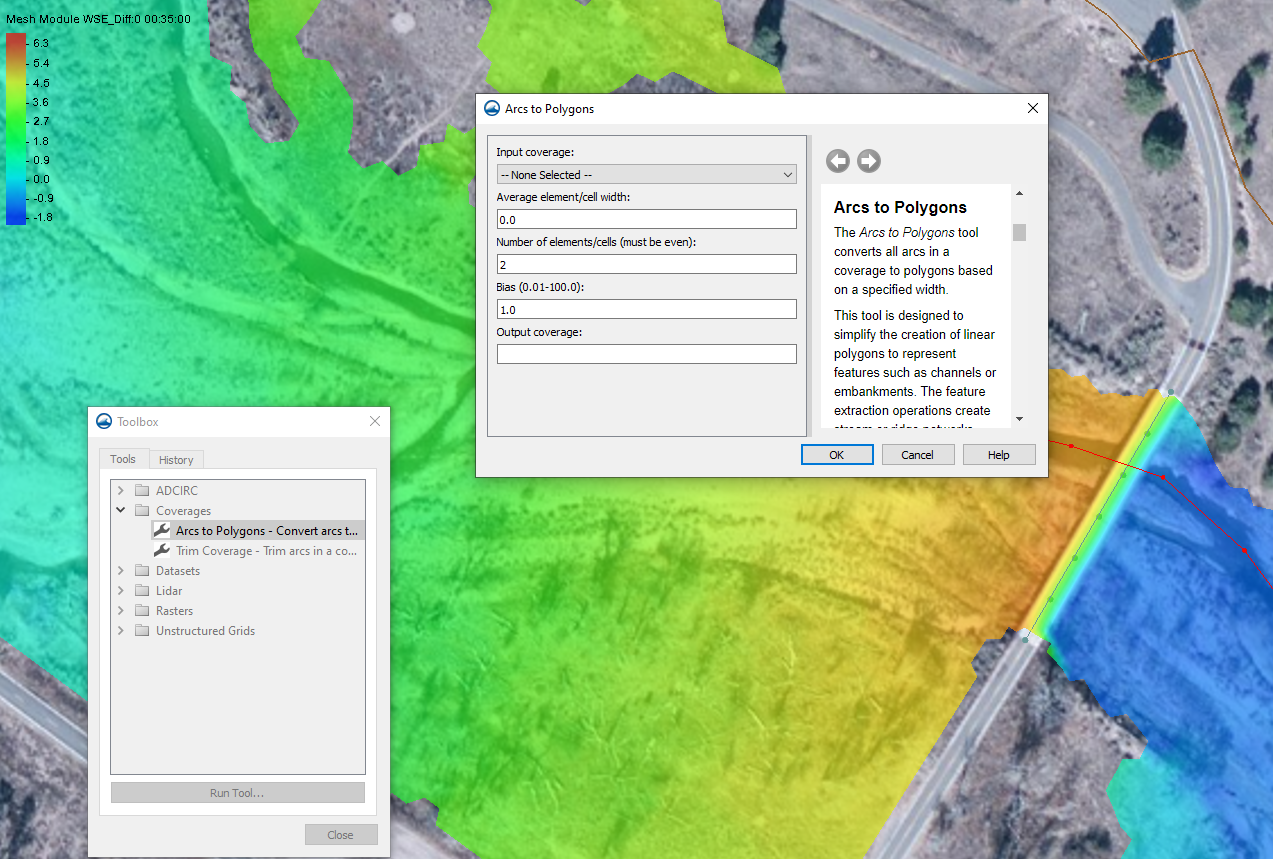
A new toolbox has been added giving you more options for adjusting and manipulating data in your projects. The toolbox contains many of the tools that are in the Dataset Toolbox with the addition of several more tools. Additional tools will be added to this toolbox in future versions of SMS.

Example of the Toolbox in SMS 13.2
Display Themes

The Display themes tool allows you to save your display options settings which can be reused later or applied to other models. Specific display options and views can be saved as display themes. Furthermore, you can have multiple display themes in a project. This makes it easier to switch between different regularly used displays.

UGrid Clipping

SMS continues to improve its features for unstructured grids (UGrid). The UGrid module now has an additional option for clipping. This option can be found in the UGrid Display Options. Turning on the UGrid clipping option allows you to create a "clipping widget" that you can use to hide part of your Ugrid. Primarily this feature allows you to view cross sections of a UGrid.

Model Interface Updates

The interface for a couple models have been updated. This includes CMS-Wave and TUFLOW-FV. These interface updates make use of workflows similar to CMS-Flow and SRH-2D. Additional functionality has also been added to these models.

These are just a few of the features that are a part of SMS 13.2 beta. Try out these features and many more by downloading the SMS 13.2 Beta today!

Blog tags: 

Understanding SRH-2D Obstructions

Do you have an SRH-2D project that might benefit from using obstruction objects? The obstruction coverage in SMS allows you to add obstruction objects to your SRH-2D project. Using obstructions in some cases can be beneficial, but there are a few key ideas to keep in mind. This post will cover some of these.

Adding obstructions to an SRH-2D project involves creating a coverage assigned as an SRH-2D obstruction type coverage. On this coverage, you can draw arcs and points to act as obstruction objects. Each arc and point can be assigned obstruction attributes. Finally, the obstructional coverage can be added to the SRH-2D simulation to be used in the model run.

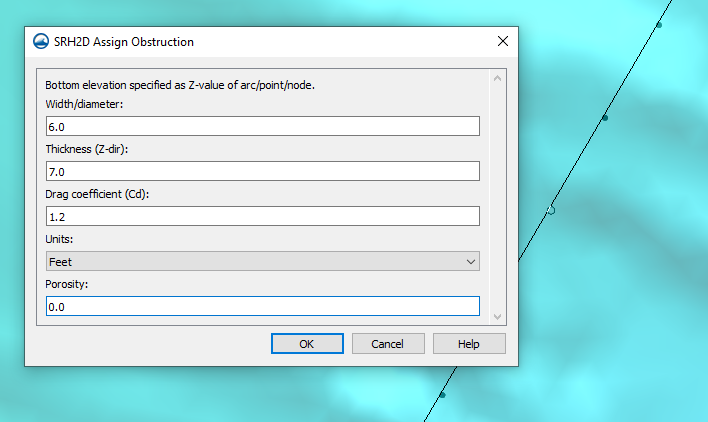
Example of the SRH-2D Assign Obstructions dialog

First, it is important to understand how obstructions interact with the model run. Obstruction objects on the obstruction coverage will reduce the flow of water through the model by applying a drag force. Water will not flow around the obstruction but will instead be slowed by the drag force of the obstruction. The assigned attributes on the obstruction object will determine which cell nodes on the mesh will be assigned as an obstruction. Obstructions can be used for items like bank protrusions and boulder clusters.

Second, when assigning obstruction attributes to an obstruction object, a width/diameter is specified in SMS. For point obstructions, this user-specified value is then converted by PreSRH-2D to a radius for SRH-2D. The SRH-2D model applies the radius around the point. For line obstructions, the arc definition and width are converted by PreSRH-2D to point locations that define the obstruction area. That means, for example, if you assign an arc to have an obstruction width/diameter value of 2 meters, then 1 meter on one side of the arc and 1 meter on the other side of the arc will be the obstruction area.

Third, obstruction objects can be assigned a drag coefficient, porosity, and a specific thickness. It is important to note that obstruction objects are not meant to completely impede the flow of water.

For items that completely block the flow of water, such as bridge piers or buildings, a void in the mesh should be created that models the area of blockage in most cases. Likewise, having a large number of obstruction objects in your model sometimes can cause issues with the SRH-2D model run and therefore it is recommended that obstruction objects be used judiciously.

Obstructions can be a valuable addition to your SRH-2D model. Try using obstructions with SRH-2D in SMS today!.

Blog tags: 

Understanding the Smooth Datasets Tool in SMS

Do you have a dataset, or survey data, that has random distances between points which you would like to have a more uniform distribution? SMS contains a tool that allows you to smooth data. By using the Smooth Datasets tool you can create a new dataset that has a more even distribution.

To use the Smooth Dataset tool, do the following:

  1. Make certain you have the Scatter module containing the dataset active. If your dataset is in a different geometry, it may need to be converted to a scatter set.
  2. Use the Dataset Toolbox command in the Data menu to open the Dataset Toolbox.
  3. Select the Smooth Dataset tool under the list of tools.
  4. Enter the parameters for smoothing the dataset.
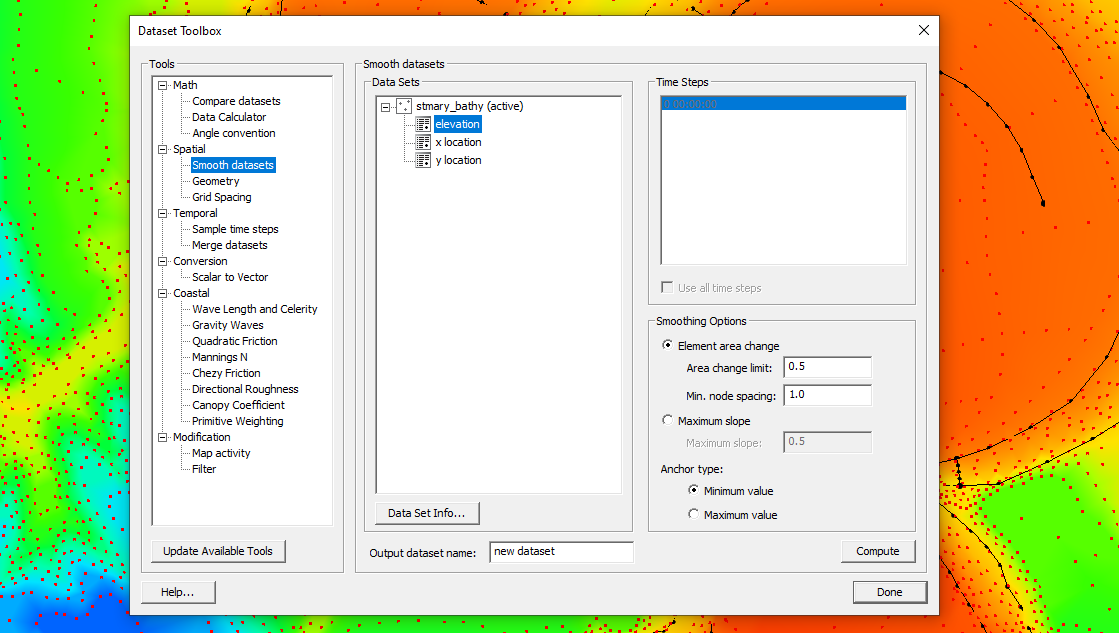
The Smooth Datasets tool in the Dataset Toolbox

When using the Smooth Dataset tool there are a few items to keep in mind:

  • There are no restrictions related to X or Y point distribution. In other words, the dataset points don’t need to align with a grid.
  • The "Element Area Change" option is only recommended when smoothing size functions for certain meshing methods (i.e. scalar paving).
  • When smoothing elevations, the "Maximum slope" method is recommended. This function works with any scalar dataset, but I will assume elevation as the dataset for this explanation.
  • When using the "Maximum slope" method, the elevation of a starting point is compared with its neighboring points (connected via triangles). The elevation of a neighboring point is adjusted if the slope between the points exceeds the specified maximum.
  • The "Anchor type" determines the starting point.
  • If "Minimum value" is selected, SMS starts at the point with the lowest elevation, and the elevations of its neighboring points are adjusted if necessary. SMS then continues to the point with the next lowest elevation.

The Smooth Dataset tool can help you resolve issues with raw data and help your model be more efficient. Try out the Smooth Dataset tool in SMS today!

Blog tags: 

Pages